Believe In The BestMount Pleasant Brampton Real Estate Guide (2026)Prices, GO Transit access, and buyer trends in Brampton West's transit-oriented village communityGO Transit Access Modern Homes

Dated: December 13 2025
Views: 518
Before reviewing our historical regional overview, make sure to look at the current Average House Price in Brampton to see how local home values are trending today.
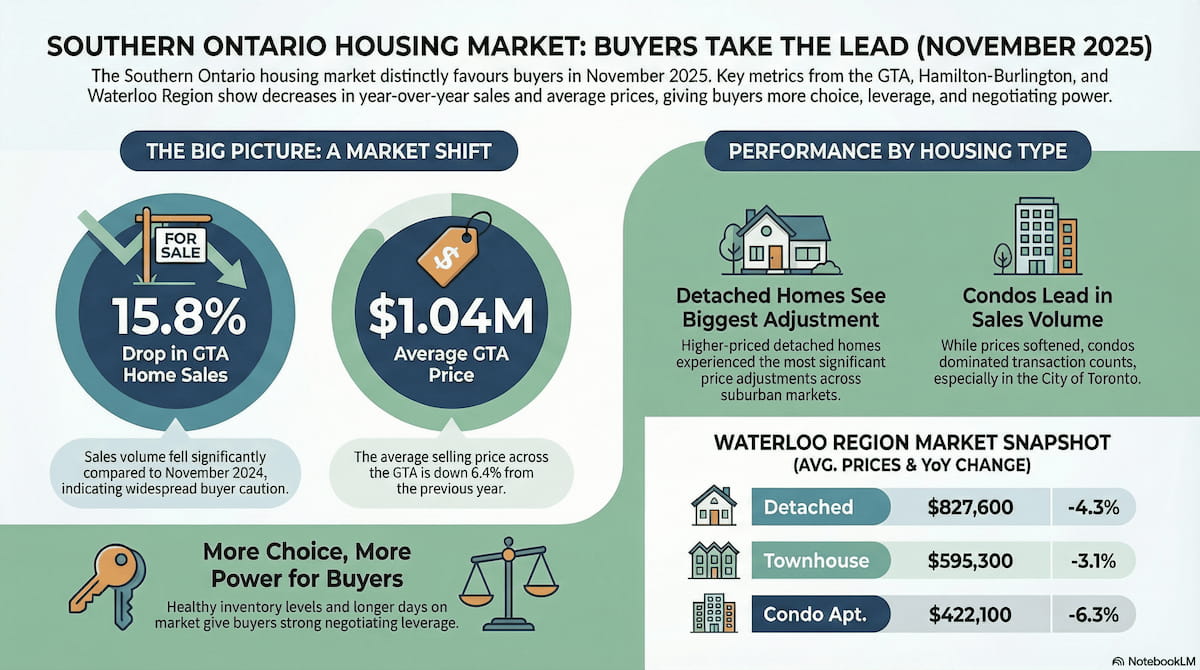 Southern Ontario’s housing market in November 2025 leaned clearly in favour of buyers, with sales down year-over-year and average prices edging lower or flat across the GTA, Hamilton-Burlington, and Waterloo Region. Inventory remained healthy in most submarkets, giving buyers more choice and negotiating leverage while many sellers adjusted expectations to a slower, interest-rate-sensitive environment.
Across the Greater Toronto Area, MLS home sales fell 15.8% versus November 2024, with 5,010 transactions recorded and new listings down 4% to 11,134, confirming that many buyers remained cautious despite lower borrowing costs. The average GTA selling price came in at about million, down 6.4% year-over-year, while the MLS HPI composite benchmark declined 5.8%, but both measures were essentially flat compared with October on a seasonally adjusted basis.
TRREB data shows average prices and benchmark values have stabilized on a month-to-month basis even as sales volumes lag, signalling a “slow but sticky” market rather than a free-fall. Hamilton-Burlington also reported fewer sales and year-over-year price declines in November, while Waterloo Region saw sales drop well below the 10‑year average and average prices fall compared with both last year and October, underscoring a broad regional cooling.
From a user-intent perspective, these numbers answer several core questions: Southern Ontario is broadly in a balanced-to-buyer-leaning market in November 2025, average prices are slightly down year-over-year, and conditions are notably softer than both November 2024 (for sales) and the long-term norms, but more stable than earlier in 2023–2024.
TRREB’s November 2025 Market Watch confirms that buyers across the GTA had “a well-supplied resale market,” even as sales dropped more sharply than new listings, pushing the sales-to-new-listings ratio into buyer-leaning territory in many districts. Economic commentary in the same report links weak sales more to confidence and employment uncertainty than to pure affordability, with TRREB noting that stronger-than-expected economic data late in 2025 could set the stage for improved sentiment into 2026.
Within the GTA, average prices remained highest in core city and prime 905 nodes but broadly tracked the composite trend: year-over-year declines in the mid-single to high-single digits, and only marginal month-over-month movement. Detached homes continued to command the largest share of dollar volume in suburban markets, while condo apartments dominated transaction counts in the City of Toronto, especially in the central districts.
In the City of Toronto proper, the average selling price across all home types hovered just above the GTA composite but still reflected year-over-year declines, consistent with the broader 6.4% drop across the board. Central condo-heavy neighbourhoods saw active listings remain elevated, giving buyers more choice and keeping selling prices close to list, while low-rise segments in the west and east end showed more negotiation room as days-on-market increased.
For buyers searching “Toronto real estate market November 2025,” the key takeaway is that prices are softer than a year ago, but not collapsing, and well-qualified purchasers can negotiate on both price and conditions—especially on properties that have sat on the market beyond the average marketing time. Sellers in the city must price tightly to recent comparable sales and be prepared for longer exposure times than during the 2021–2022 peaks.
Peel Region mirrored the 905 trend of lower sales and modest price erosion, with detached inventory in Brampton and Mississauga particularly ample compared with historic norms. Average prices for detached and semis in Peel tracked slightly below the overall 905 average but remained well above pre‑2020 levels, creating opportunities for move-up buyers trading condos or townhomes into larger properties.
Neighbourhoods with strong transit access and family-oriented amenities—such as pockets near Hurontario LRT stations in Mississauga and established school zones in north Brampton—continued to hold value better than peripheral subdivisions, where buyers were more price-sensitive. Investors focusing on secondary units and basement apartments also benefited from Peel’s strong rental demand and slowing purchase activity.
York Region’s November 2025 data shows some of the steepest average price points in the GTA, especially for detached homes in Markham, Vaughan, Aurora, and King, but with year-over-year price changes directionally in line with the GTA-wide 5–7% declines. Sales counts for higher-priced detached product dropped more than for townhouses and condos, reflecting sensitivity to interest rates and larger mortgage balances.
For user queries like “Which areas have the biggest price drops?”, several York Region communities with a large share of luxury and executive homes saw more pronounced downward adjustments when compared to 2024, particularly where sellers initially anchored to 2021–2022 valuations. By contrast, more moderately priced townhome corridors in Markham and Newmarket held up better on a percentage basis, thanks to steady end-user demand.
Durham continued to offer some of the best relative affordability in the GTA, with average prices significantly below the GTA composite but still higher than pre‑pandemic levels. Sales activity declined in line with the overall 15.8% GTA drop, yet detached homes in Oshawa, Clarington, and Whitby remained attractive to first‑time and move‑over buyers priced out of Toronto and York.
Top neighbourhoods for buyers in November 2025 included east‑Durham family subdivisions and areas near GO Transit, where buyers could secure larger lots and newer homes at pronounced discounts to core‑GTA pricing. Investors focused on cash flow found Durham’s rent-to-price ratios relatively favourable compared to central Toronto, albeit with slightly slower appreciation expectations.
Halton’s November 2025 figures show higher average prices and a greater share of detached and luxury inventory than most other 905 regions, particularly in Oakville and select Burlington pockets. Sales volumes trended lower on a year-over-year basis, but listing supply remained healthy, keeping the market balanced to buyer-leaning and tightening negotiating spreads.
In Milton and parts of north Oakville, newer subdivision product with good highway access remained in steady demand from young families, cushioning price declines relative to older stock and rural fringe properties. Buyers seeking “top neighbourhoods for home buyers in November 2025” in Halton would see value in areas that pair quality schools with realistic seller expectations, rather than purely trophy locations where sellers remain anchored to past peaks.
The REALTORS Association of Hamilton-Burlington (RAHB) reported 624 home sales across Hamilton, Burlington, Haldimand County, and Niagara North in November, reflecting a decline in activity amid the seasonal and confidence-driven slowdown. At the same time, new listings and active inventory stayed elevated enough to keep conditions favourable for buyers, with sales-to-new-listings ratios pointing away from a strong seller’s market.
Year-over-year, both average prices and benchmark values in the Hamilton-Burlington area were lower, building on October data that already showed a multi-percent decline in detached, townhouse, and condo segments compared with 2024. Buyers asking “Hamilton house prices November 2025” will find that while prices are down from their peak, they remain meaningfully above 2018–2019 levels, and the bigger story is improved choice, more conditional offers, and greater flexibility on terms.
Within Hamilton proper, more affordable low-rise neighbourhoods continued to see steady interest from first‑time buyers and GTA move-overs, but at more conservative price points and with less urgency than in the past. Burlington’s higher-priced detached market saw longer days on market and more frequent price adjustments, which created selective opportunities for upsizers willing to negotiate and hold long term.
Brantford and outlying communities positioned along major highway corridors benefitted from buyers seeking a balance between affordability and commuting, with inventory levels offering meaningful choice but requiring sharper pricing from sellers. Investors favouring duplexes and small multifamily assets in Hamilton and surrounding municipalities could often secure properties with more attractive cap rates than in core GTA markets due to the combination of lower prices and resilient rental demand.
Waterloo Region’s November 2025 housing market saw 465 homes sold through the MLS system, a drop of 14.8% compared with November 2024 and about 25% below the 10-year average for the month. This decline in sales, combined with rising inventory levels—the highest in over a decade—firmly tilted conditions toward buyers, with more listings competing for fewer purchasers.
The overall average sale price in Waterloo Region reached roughly , down 5.4% year‑over‑year and 2.7% from October, reflecting both softer demand and more negotiation room. Detached homes averaged about (down 4.3% year‑over‑year), townhouses about (down 3.1%), condos about (down 6.3%), and semis about (down 1.4%). For users searching “Waterloo Region real estate update November 2025,” the key message is that buyers enjoy the strongest negotiating position seen in years, particularly in higher‑priced detached segments.
The following table summarizes how major housing types performed across Southern Ontario’s core markets, using composite patterns from TRREB (GTA), RAHB (Hamilton‑Burlington), and WRAR (Waterloo Region):
Overall, detached homes bore the brunt of price adjustment in higher‑priced suburbs and exurbs, while condos and townhouses showed more mixed results depending on local affordability and investor demand. Inventory was most comfortable in detached and freehold segments, creating more room for conditions (financing, inspection) and price negotiations, while well‑located condos in transit‑rich nodes remained comparatively liquid.
TRREB’s November Market Watch ties much of the current slowdown to consumer confidence rather than to pure borrowing cost metrics, pointing to stronger-than-expected Canadian employment and GDP data as potential catalysts for improved activity in 2026. The report notes that many GTA households are poised to take advantage of lower borrowing costs and softer prices but are waiting for more certainty around long‑term employment and macroeconomic conditions.
On the financing side, Bank of Canada policy earlier in 2025 saw rates move off peak levels, which improved stress‑test outcomes and monthly payment calculations but did not fully offset sentiment headwinds. At the same time, all three major boards stress that today’s comfortable resale inventory does not erase structural supply challenges, especially in ground‑oriented housing, and warn that once demand returns, lack of new construction could reintroduce upward price pressure.
Immigration and population growth, while not quantified month-by-month in the market reports, remain important context: sustained inflows to the GTA, Hamilton, and Waterloo Region continue to support underlying demand for both ownership and rental housing, even when monthly sales volumes temporarily sag. Local policy discussions across Southern Ontario increasingly focus on missing‑middle housing supply, transit‑oriented density, and incentives for purpose-built rental, themes that are echoed in TRREB’s call for governments to “build more homes for Ontarians.”
Market sentiment in November 2025 can best be described as cautious but opportunistic: buyers know they have more leverage, while sellers still recall peak‑era pricing and are adjusting in uneven steps. TRREB’s commentary highlights that buyer hesitation stems more from uncertainty about the broader economy than from today’s actual mortgage rates, which are lower than the 2023 peak but still above the ultra‑low era.
In practice, this translated into:
Longer days on market and more terminated/relisted properties in many submarkets
A higher share of offers containing financing and inspection conditions
Wider gaps between initial list prices and ultimate selling prices where sellers mispriced relative to the new reality
Conversely, serious buyers—whether end users or investors—used these conditions to secure concessions on price, closing flexibility, and repairs, particularly on homes that had lingered on the market. Sellers who priced realistically to recent comparables and staged effectively still achieved solid outcomes, demonstrating that the market rewards alignment with data, not nostalgia.
TRREB’s forward-looking comments suggest that if encouraging employment and GDP data persist, 2026 could see renewed homebuyer confidence and a gradual recovery in sales volumes. With inventory currently ample and prices down mid‑single to high‑single digits year-over-year, the risk skew is toward a modest firming in demand rather than a further deep correction, especially if rate cuts or stable policy continue.
For Q4 2025, the typical seasonal slowdown is likely to compound the existing caution, keeping sales subdued through December and early January. Into Q1 2026, two scenarios are plausible: a “soft thaw” in which improved economic news and stable rates coax more buyers off the sidelines, or a prolonged sideways market if macro uncertainty persists, in which case prices would likely remain range‑bound with modest downward pressure in weaker submarkets.
In response to “Is it a good time to buy or sell in Southern Ontario in November 2025?”:
For buyers with stable employment and financing, current conditions offer more choice, better terms, and lower prices than a year ago—an objectively favourable environment for long‑term holds.
For sellers, timing is more nuanced: those trading within the same market benefit from selling lower but also buying lower, while discretionary sellers may prefer to wait for improved sentiment if they can do so without financial strain.
In a November 2025 market defined by abundant data, mixed sentiment, and local variation between micro‑neighbourhoods, Royal Canadian Realty’s value lies in translating regional statistics into property‑specific strategy. Real-time interpretation of TRREB, RAHB, and WRAR releases allows advisors to show clients exactly how a given street or building is performing relative to its broader board area, rather than relying on generic headlines.
For buyers, this means:
Using up‑to‑the‑day board data to identify where months of inventory and sales-to-new-listings ratios signal true buyer’s‑market leverage (for example, detached segments in certain 905 and Hamilton-Burlington zones, or high‑inventory condo corridors).
Structuring offers that blend price, conditions, and closing terms to align with current days‑on‑market patterns in that submarket, increasing the chance of acceptance without overpaying.
For sellers, Royal Canadian Realty can:
Benchmark your home precisely against November 2025 sales in your board and neighbourhood, calibrating list price to where properties are actually trading—not where they were in 2021.
Deploy marketing that highlights data-driven value (recent comparables, neighbourhood trends, and board statistics) to attract serious buyers who are filtering options more analytically in a slower market.
Investors benefit from localized cash‑flow and appreciation modeling anchored in official board statistics for rents, prices, and absorption, helping them compare, for example, a townhouse in Kitchener versus a duplex in Hamilton or a condo in downtown Toronto. Across all client types, the brokerage’s client‑centric, problem‑solving approach—grounded in the same third‑party data cited here—helps navigate November 2025’s buyer‑tilted but highly segmented Southern Ontario landscape with clarity and confidence.

Your Local Buyer’s Real Estate Agent in Brampton and MississaugaBuying a home is more than just a transaction — it’s a major life decision. As a Realtor focused on helping home buyer....
Believe In The BestMount Pleasant Brampton Real Estate Guide (2026)Prices, GO Transit access, and buyer trends in Brampton West's transit-oriented village communityGO Transit Access Modern Homes
Tired of Renting in Bramalea? How to Buy Your First Home Near Bramalea City Centre with Zero Down (2026 Guide)A practical roadmap for renters near Bramalea City Centre, Central Park Drive, Clark
Helping qualified Queen Street Corridor renters explore a path from renting to homeownership in Brampton through Royal Canadian Realty's Zero Down Homeownership Program.Brampton First-Time Buyers
Royal Canadian Realty, Brokerage • "Believe In The Best"Brampton Buyer Guide · 2026First-Time Buyer Guide to Heart Lake, Brampton (2026): Prices, Schools & Top
 Toronto Real Estate Board (TRREB); All information deemed reliable but not guaranteed. All properties are subject to prior sale, change or withdrawal. Neither listing broker(s) or information provider(s) shall be responsible for any typographical errors, misinformation, misprints and shall be held totally harmless. Listing(s) information is provided for consumer's personal, non-commercial use and may not be used for any purpose other than to identify prospective properties consumers may be interested
in purchasing. The data relating to real estate for sale on this website comes in part from the Internet Data Exchange program of the Multiple Listing Service. Real estate listings held by brokerage firms other than Royal Canadian Realty, Brokerage, Mississauga may be marked with the Internet Data Exchange logo and detailed information about those properties will include the name of the listing broker(s) when required by the MLS. Copyright ©2026 All rights reserved.
Last Updated: September 25, 2026 1:02 PM UTC
Show More...
Toronto Real Estate Board (TRREB); All information deemed reliable but not guaranteed. All properties are subject to prior sale, change or withdrawal. Neither listing broker(s) or information provider(s) shall be responsible for any typographical errors, misinformation, misprints and shall be held totally harmless. Listing(s) information is provided for consumer's personal, non-commercial use and may not be used for any purpose other than to identify prospective properties consumers may be interested
in purchasing. The data relating to real estate for sale on this website comes in part from the Internet Data Exchange program of the Multiple Listing Service. Real estate listings held by brokerage firms other than Royal Canadian Realty, Brokerage, Mississauga may be marked with the Internet Data Exchange logo and detailed information about those properties will include the name of the listing broker(s) when required by the MLS. Copyright ©2026 All rights reserved.
Last Updated: September 25, 2026 1:02 PM UTC
Show More...
 All information deemed reliable but not guaranteed. All properties are subject to prior sale, change or withdrawal. Neither listing broker(s) or information provider(s) shall be responsible for any typographical errors, misinformation, misprints and shall be held totally harmless. Listing(s) information is provided for consumer's personal, non-commercial use and may not be used for any purpose other than to identify prospective properties consumers may be interested in purchasing. The data relating
to real estate for sale on this website comes in part from the Internet Data Exchange program of the Multiple Listing Service. Real estate listings held by brokerage firms other than Royal Canadian Realty, Brokerage, Mississauga may be marked with the Internet Data Exchange logo and detailed information about those properties will include the name of the listing broker(s) when required by the MLS. Copyright ©2026 All rights reserved.
Last Updated: September 25, 2026 6:00 AM UTC
Show More...
All information deemed reliable but not guaranteed. All properties are subject to prior sale, change or withdrawal. Neither listing broker(s) or information provider(s) shall be responsible for any typographical errors, misinformation, misprints and shall be held totally harmless. Listing(s) information is provided for consumer's personal, non-commercial use and may not be used for any purpose other than to identify prospective properties consumers may be interested in purchasing. The data relating
to real estate for sale on this website comes in part from the Internet Data Exchange program of the Multiple Listing Service. Real estate listings held by brokerage firms other than Royal Canadian Realty, Brokerage, Mississauga may be marked with the Internet Data Exchange logo and detailed information about those properties will include the name of the listing broker(s) when required by the MLS. Copyright ©2026 All rights reserved.
Last Updated: September 25, 2026 6:00 AM UTC
Show More...
